Search visibility
Search Console shows which queries, pages and countries are gaining demand. We separate useful movement from noise.
Architecting Authority
Groew connects search visibility, page movement, technical health, lead quality and next actions so founders can see what is compounding, what is blocked and what to fix next.
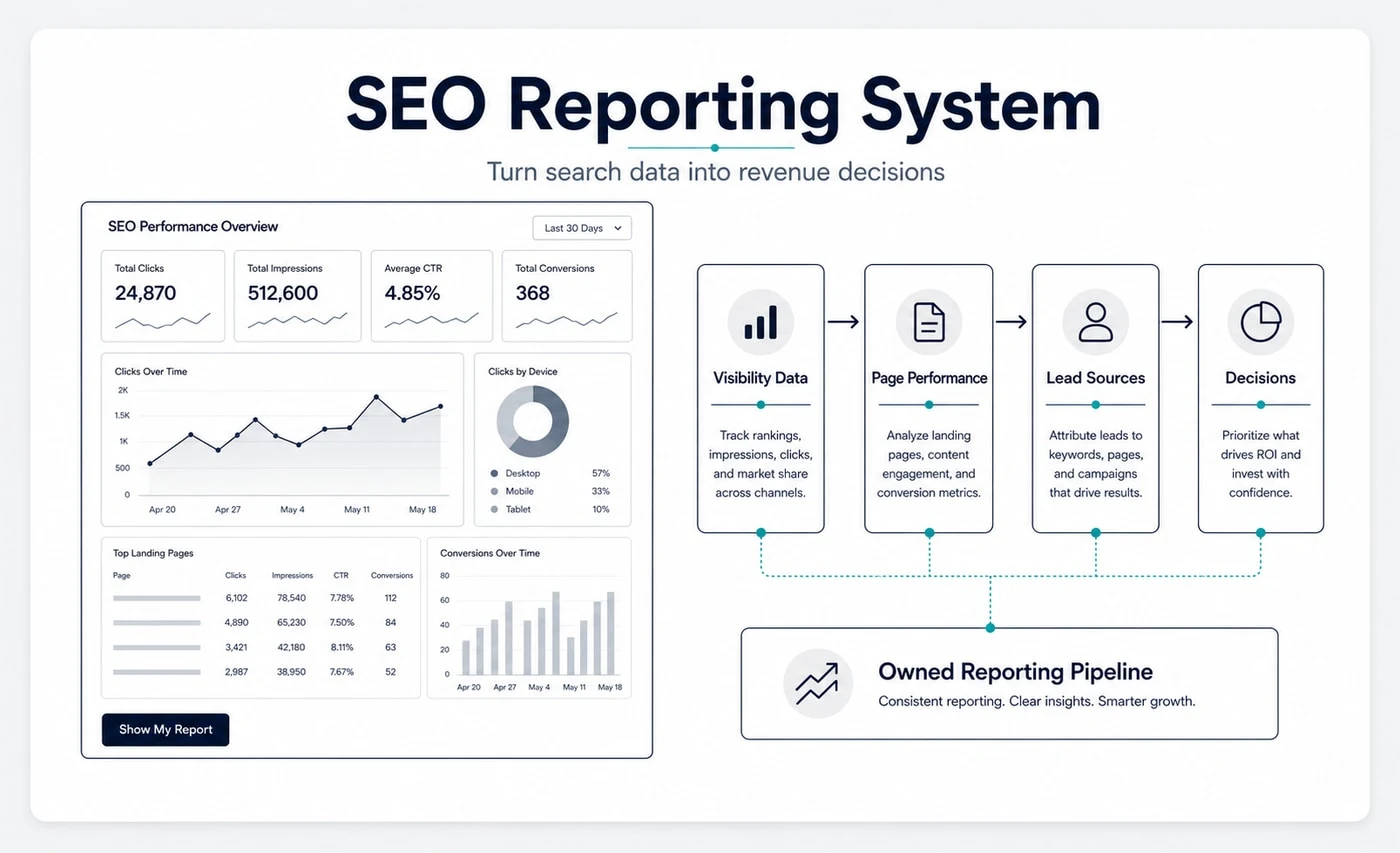
Strong reporting connects movement to the next decision. A chart without a clear fix is not a growth system.
A useful B2B SEO report shows which searches are growing, which pages are earning demand, which leads are qualified, which technical issues can slow growth and what the team should do next. Rankings, traffic and PDFs are incomplete when they do not connect to enquiries, pipeline or page level decisions.
Top agencies connect search data to business decisions. Groew does the same, then filters the data through the Revenue Infrastructure lens.
Search Console shows which queries, pages and countries are gaining demand. We separate useful movement from noise.
Rankings matter most when the page can create enquiries. We track service, industry and comparison pages separately.
A form fill is not always pipeline. We connect source notes, CRM data and founder feedback where the data is available.
Indexing, canonical rules, Core Web Vitals, schema and crawl changes can explain sudden movement before content gets blamed.
We watch which topic clusters, refreshes and landing pages are earning impressions, clicks and buyer questions.
Buyers use AI tools before vendor calls. We check whether the brand, service pages and proof signals are being described clearly.
A founder does not need a long report full of keyword movement. A founder needs to know whether the organic system is becoming more valuable. Which pages are improving. Which pages are stuck. Which technical issues are blocking growth. Which leads are worth following. Which work should happen next.
Without that context, SEO becomes another monthly update instead of an operating system for growth.
We do not make dashboards for decoration. Each view exists to answer a specific operating question.
A short view of what changed, which pages moved and whether anything needs fast attention.
A founder level summary that shows what compounded, what stalled and what should be fixed next.
Service, industry, problem, comparison and tool pages are tracked by intent so one strong page does not hide weak pages.
Each sprint review connects completed work to search movement, technical stability, page quality and enquiry signals.
The reporting format stays simple on purpose. A founder should be able to read the first screen and understand the month without decoding charts. The deeper dashboard can hold the detail, but the decision view needs to be direct.
This is the pattern Groew uses: what moved, what blocked progress, what we shipped, what the next action is and what data is still missing.
Good reporting is honest about attribution. If CRM data, call tracking or sales source notes are missing, the report should say that clearly.
Every reporting engagement should make the organic system easier to manage. These are the practical outputs we use to keep the work clear.
We can still audit the reporting setup with limited access, but the strongest view needs search data, conversion data and lead quality feedback.
Technical SEO reporting should show crawl, index, schema and site speed stability. Content reporting should show page groups, topic depth, buyer questions and refresh impact. Authority reporting should show credible mentions, branded demand and the pages supported by trust signals.
That separation matters because one dashboard cannot answer every question. Groew reports by service layer so the right constraint is visible.
These outcomes came from Revenue Infrastructure, not reporting alone. Reporting made the system visible enough to decide what to fix, where to invest and which pages were creating business movement.
When a data infrastructure company increased organic conversions by 404%, the useful question was not only traffic growth. The useful question was which commercial pages and regional pages created the increase.
Organic conversions increased 404% after commercial page clarity, service page structure and regional pages were fixed.
Read My Conversion Story →Organic authority helped create $17.5M plus in new investor capital after trust sensitive pages were improved.
Read My Trust Story →Organic traffic increased 410% in 7 months and generated 120 plus monthly quote requests from solution pages.
Read My Quote Story →The report should show whether the next constraint is technical, content, authority, landing pages or the full system.
Connect reporting to the full organic system, from crawl health to buyer intent.
Show Me B2B SEO Infrastructure →Find the crawl, index and schema issues that explain unstable reporting data.
Review My Technical Foundation →Turn reporting into decisions about pages, clusters, refreshes and buyer questions.
Map My Content System →These tools help reveal whether the issue is the page, topic depth, AI visibility or measurement discipline.
Check title, headings, schema, links and page evidence before reporting the page as healthy.
Run My SEO Audit →See whether your content system has enough depth to support organic growth.
Check My Topic Depth →Check whether AI tools can understand and describe your company clearly.
Check My AI Visibility →Compare marketing spend against revenue so organic reporting stays tied to business reality.
Calculate My MER →
When I review SEO reporting for a founder, I look for the missing decision. In one data infrastructure story, organic conversions increased 404% after the commercial pages and regional pages were fixed. The report mattered because it showed where the movement came from, not because it made the chart look better. Reporting should protect Revenue Infrastructure from guesswork.
We will review your current reporting, page groups, technical signals, lead tracking and the decisions your team can make from the data.
Audit My SEO Reporting